Making your own visualizations
Picasso is made with ease of adding new models in mind. This tutorial will show you how to make a new visualization from scratch. Our visualization will be based on the very simple ClassProbabilities (see ClassProbabilities code) visualization, along with its HTML template.
Setup
Every visualization requires a class defining its behavior and an HTML template defining its layout. You can put them in the visualizations and templates folder respectively. It’s important that the class name and HTML template name are the same.
For our example, FunViz, we’ll need picasso/visualizations/fun_viz.py:
from picasso.visualizations.base import BaseVisualization


class FunViz(BaseVisualization):

    DESCRIPTION = 'A fun visualization!'

    def make_visualization(self, inputs, output_dir, settings=None):
        pass
and picasso/templates/FunViz.html:
{% extends "result.html" %}
{% block vis %}
your visualization html goes here
{% endblock %}
Some explanation for the FunViz class in fun_viz.py: All visualizations should inherit from BaseVisualization. You can also add a description which will display on the landing page.
Some explanation for FunViz.html: The web app is uses Flask, which uses Jinja2 templating. This explains the funny {% %} delimiters. The {% extends "result.html" %} just tells the your page to inherit from a boilerplate. All your html should sit within the vis block.
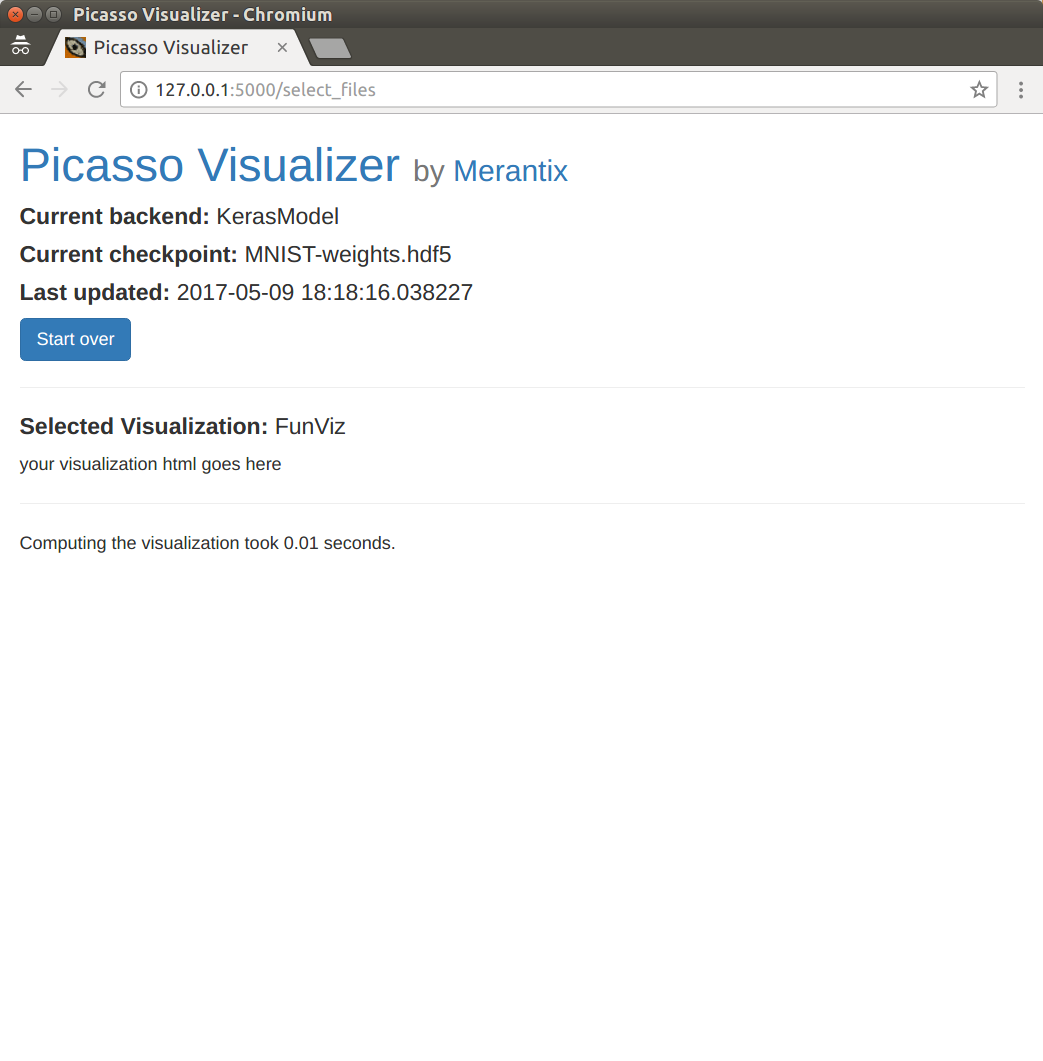
You can even start the app at this point (see Quickstart). You should see your visualization in the menu.

Are we having fun yet? ☆(◒‿◒)☆ YES
If you try to upload images, you will get an error. This is because the visualization doesn’t actually return anything to visualize. Let’s fix that.
Add visualization logic
Our visualization should actually do something. It’s just going to compute the class probabilities and pass them back along to the web app. So we’ll add:
from picasso.visualizations.base import BaseVisualization


class FunViz(BaseVisualization):

    DESCRIPTION = 'A fun visualization!'

    def make_visualization(self, inputs, output_dir):
        pre_processed_arrays = self.model.preprocess([example['data']
                                                     for example in inputs])
        predictions = self.model.sess.run(self.model.tf_predict_var,
                                          feed_dict={self.model.tf_input_var:
                                                     pre_processed_arrays})
        filtered_predictions = self.model.decode_prob(predictions)
        results = []
        for i, inp in enumerate(inputs):
            results.append({'input_file_name': inp['filename'],
                            'predict_probs': filtered_predictions[i]})
        return results
Let’s go line by line:
...

class FunViz(BaseVisualization):
    ...

    def make_visualization(self, inputs, output_dir):
        pre_processed_arrays = self.model.preprocess([example['data']
                                                     for example in inputs])
        ...
inputs are sent to the visualization class as a list of {'filename': ... , 'data': ...} dictionaries. The data are PIL Images created from raw data that the user has uploaded to the webapp. The preprocess method of model simply turns the input images into appropriately-sized arrays for the input of whichever computational graph you are using. Therefore, pre_processed_arrays is an array with the first dimension equal to the number of inputs, and subsequent dimensions determined by the preprocess function.
...

class FunViz(BaseVisualization):
    ...

    def make_visualization(self, inputs, output_dir):
        pre_processed_arrays = self.model.preprocess([example['data']
                                                     for example in inputs])
        predictions = self.model.sess.run(self.model.tf_predict_var,
                                          feed_dict={self.model.tf_input_var:
                                                     pre_processed_arrays})
        ...
Here’s where we actually do some computation to be used in the visualization. Note that the model object exposes the Tensorflow session (regardless of if the backend is Keras or Tensorflow). We also store the input and output tensors with the model members tf_input_var and tf_predict_var respectively. Thus this is just a standard Tensorflow run which will return an array of dimension n x c where n is the number of inputs, and c is the number of classes.
...

class FunViz(BaseVisualization):
    ...

    def make_visualization(self, inputs, output_dir):
        pre_processed_arrays = self.model.preprocess([example['data']
                                                     for example in inputs])
        predictions = self.model.sess.run(self.model.tf_predict_var,
                                          feed_dict={self.model.tf_input_var:
                                                     pre_processed_arrays})
        filtered_predictions = self.model.decode_prob(predictions)
        ...
decode_prob is another model-specific method. It gives us back the class labels from the predictions array. The format will be list of dictionaries in the format [{'index': class_index, 'name': class_name, 'prob': class_probability}, ...]. It will also only return the top class predictions (this comes in handy when using models like VGG16, which has 1000 classes).
...

class FunViz(BaseVisualization):
    ...

    def make_visualization(self, inputs, output_dir):
        pre_processed_arrays = self.model.preprocess([example['data']
                                                     for example in inputs])
        predictions = self.model.sess.run(self.model.tf_predict_var,
                                          feed_dict={self.model.tf_input_var:
                                                     pre_processed_arrays})
        filtered_predictions = self.model.decode_prob(predictions)
        results = []
        for i, inp in enumerate(inputs):
            results.append({'input_file_name': inp['filename'],
                            'predict_probs': filtered_predictions[i]})
        return results
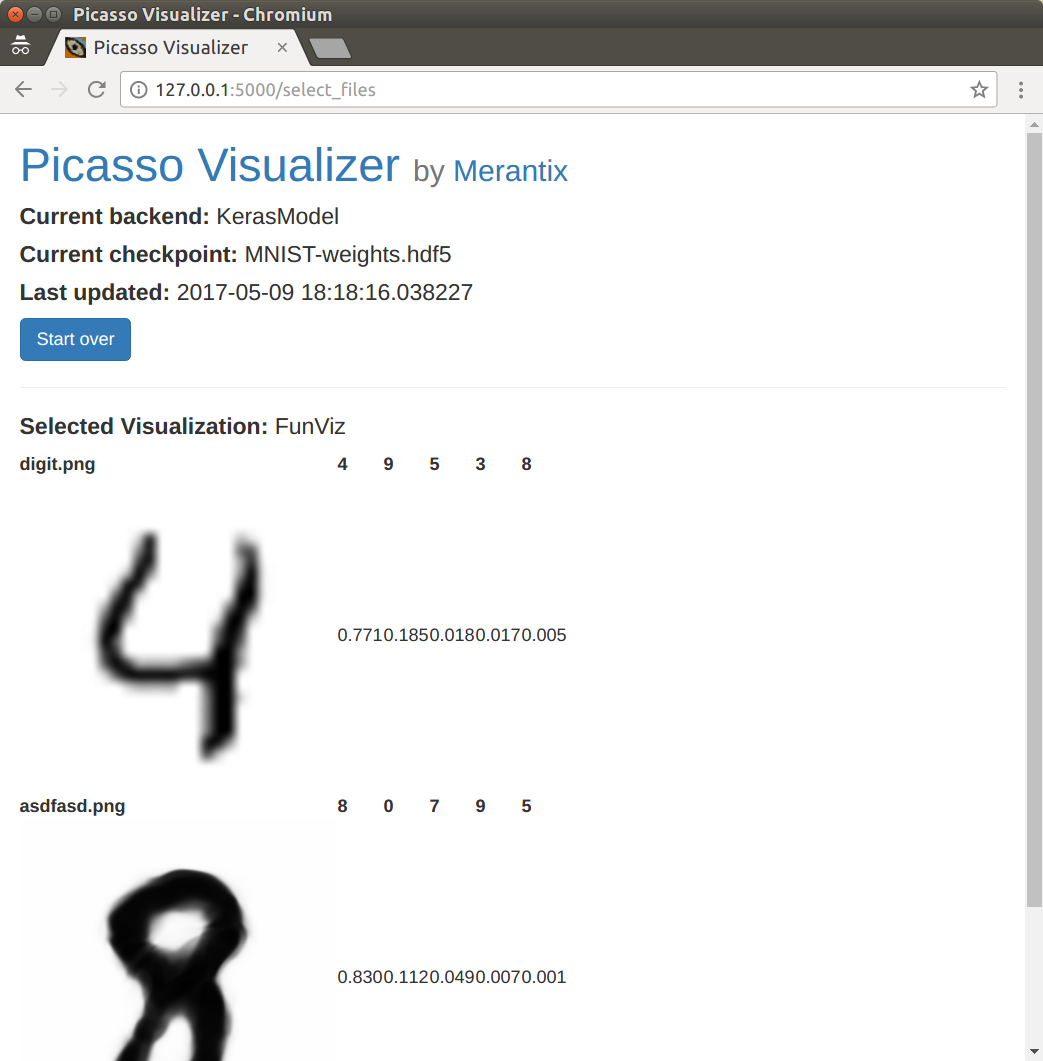
Here we arrange the results to pass back to the webapp. In our case, we just return a list of dictionaries which hold the original filename, and the formatted prediction results. The exact structure isn’t so important, but you’ll have to deal with it when you write your HTML template, so try to keep it manageable. Now you’ll be able to see your result page from earlier.

At least it’s fast, right?
Of course, we haven’t told the template how to display the results yet. Let’s get down to it.
Configure the HTML template
We need to specify how to layout our visualization. Here are the lines we’ll add:
{% extends "result.html" %}
{% block vis %}
<table>
{% for result in results %}
    <tr>
      <td><b> {{ result.filename }} </b></td>
      {% for predict_prob in result.predict_probs %}
        <td><b> {{ predict_prob.name }} </b></td>
      {% endfor %}
    </tr>
    <tr>
      <td>
        <img src="inputs/{{ result.filename }}" style="width:244px;height:244px;"/>
      </td>
      {% for predict_prob in result.predict_probs %}
        <td> {{ predict_prob.prob }} </td>
      {% endfor %}
    </tr>
{% endfor %}
</table>
{% endblock %}
Let’s look at the pieces separately again:
{% extends "result.html" %}
{% block vis %}
<table>
{% for result in results %}
    <tr>
      <td><b> {{ result.filename }} </b></td>
      {% for predict_prob in result.predict_probs %}
        <td><b> {{ predict_prob.name }} </b></td>
      {% endfor %}
    </tr>
    <tr>
      <td>
        <img src="inputs/{{ result.filename }}" style="width:244px;height:244px;"/>
      </td>
      {% for predict_prob in result.predict_probs %}
        <td> {{ predict_prob.prob }} </td>
      {% endfor %}
    </tr>
{% endfor %}
</table>
{% endblock %}
Every visualization gets a results object from the web app. The results object will have the exact same structure as the return value of the make_visualization method of your visualization class. Since we returned a list, we iterate over it with this for-loop to generate the rows of the table.
{% extends "result.html" %}
{% block vis %}
<table>
{% for result in results %}
    <tr>
      <td><b> {{ result.filename }} </b></td>
      {% for predict_prob in result.predict_probs %}
        <td><b> {{ predict_prob.name }} </b></td>
      {% endfor %}
    </tr>
    <tr>
      <td>
        <img src="inputs/{{ result.filename }}" style="width:244px;height:244px;"/>
      </td>
      {% for predict_prob in result.predict_probs %}
        <td> {{ predict_prob.prob }} </td>
      {% endfor %}
    </tr>
{% endfor %}
</table>
{% endblock %}
There are actually two rows per result. One with the filename and class labels, and one with the input image and class probabilities. Let’s look at each in turn.
{% extends "result.html" %}
{% block vis %}
<table>
{% for result in results %}
    <tr>
      <td><b> {{ result.filename }} </b></td>
      {% for predict_prob in result.predict_probs %}
        <td><b> {{ predict_prob.name }} </b></td>
      {% endfor %}
    </tr>
    <tr>
      <td>
        <img src="inputs/{{ result.filename }}" style="width:244px;height:244px;"/>
      </td>
      {% for predict_prob in result.predict_probs %}
        <td> {{ predict_prob.prob }} </td>
      {% endfor %}
    </tr>
{% endfor %}
</table>
{% endblock %}
The first column has the filename and the class name headers. The for-loop loops over the result.predict_prob list of predictions (which we generated in make_visualization) and puts each class header in a cell.
{% extends "result.html" %}
{% block vis %}
<table>
{% for result in results %}
    <tr>
      <td><b> {{ result.filename }} </b></td>
      {% for predict_prob in result.predict_probs %}
        <td><b> {{ predict_prob.name }} </b></td>
      {% endfor %}
    </tr>
    <tr>
      <td>
        <img src="inputs/{{ result.filename }}" style="width:244px;height:244px;"/>
      </td>
      {% for predict_prob in result.predict_probs %}
        <td> {{ predict_prob.prob }} </td>
      {% endfor %}
    </tr>
{% endfor %}
</table>
{% endblock %}
The second row contains the input image and the actual numerical probabilities. Note the inputs/ in the img tag. All input images are stored here by the web app.

Sooo beautiful ⊂◉‿◉つ
Similarly, there is an outputs/ folder (not shown in this example). Its path is passed to the visualization class as output_dir. Anything the visualization stores there is also available to the template (for example, additional images needed for the visualization).
Add some settings
Maybe we’d like the user to be able to limit the number of classes shown. We can easily do this by adding an ALLOWED_SETTINGS property to the FunViz class.
from picasso.visualizations import BaseVisualization


class FunViz(BaseVisualization):

    ALLOWED_SETTINGS = {'Display': ['1', '2', '3']}

    DESCRIPTION = 'A fun visualization!'

    @property
    def display(self):
        return int(self._display)

    def make_visualization(self, inputs, output_dir, settings=None):
        pre_processed_arrays = self.model.preprocess([example['data']
                                                     for example in inputs])
        predictions = self.model.sess.run(self.model.tf_predict_var,
                                          feed_dict={self.model.tf_input_var:
                                                     pre_processed_arrays})
        filtered_predictions = self.model.decode_prob(predictions)
        results = []
        for i, inp in enumerate(inputs):
            results.append({'input_file_name': inp['filename'],
                            'predict_probs': filtered_predictions[i][:self.display})
        return results
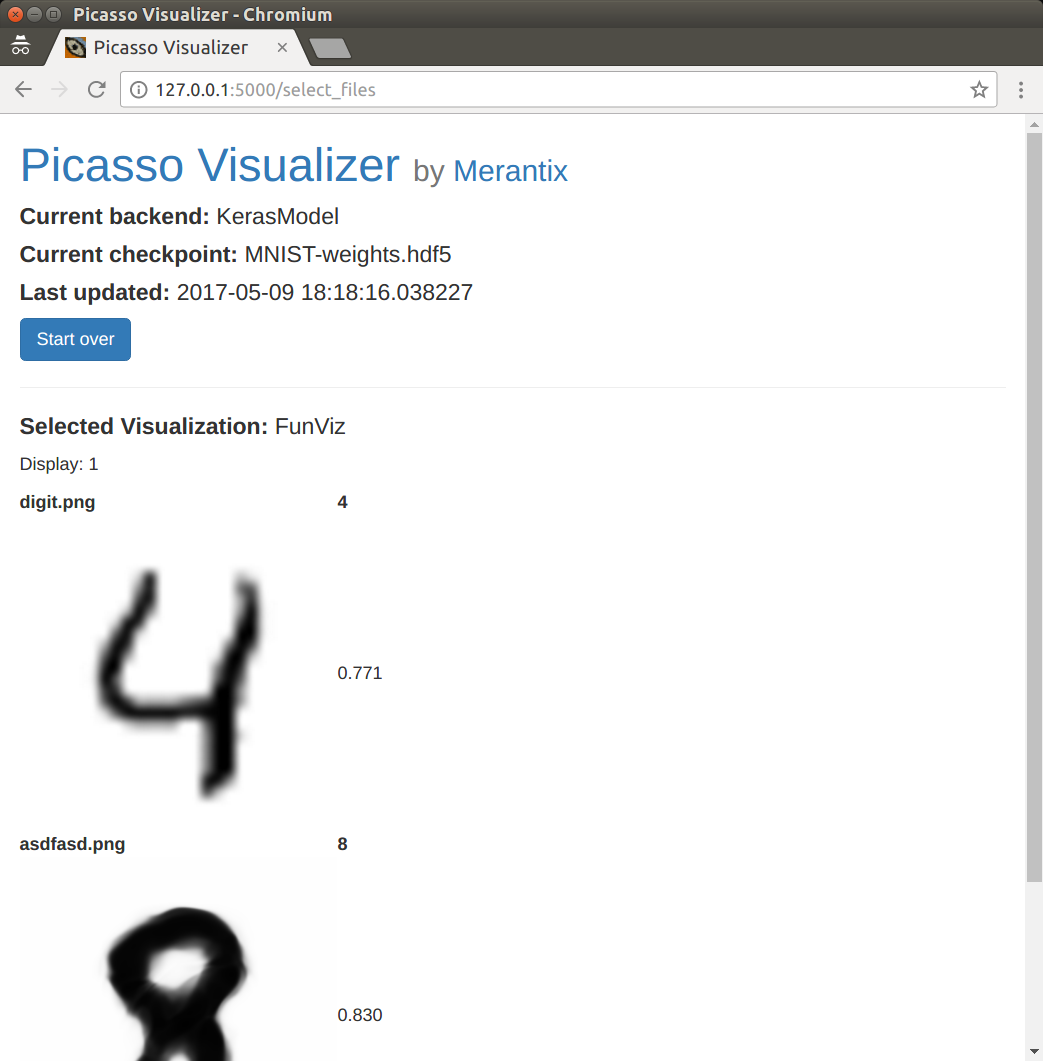
The ALLOWED_SETTINGS dict tells the web app what to display on the settings page. The names of these settings will be turned into lowercase properties preceeded by an underscore. Thus, “Display” becomes _display. You should implement a property function to cast the string to the correct type.
A page to select the settings will automatically be generated.

The automatically generated settings page

It works! ヽ(^◇^*)/
Add some styling
The template that FunViz.html derives from imports Bootstrap, so you can add some fancier styling if you like!
{% extends "result.html" %}
{% block vis %}
<table class="table table-sm table-striped">
     <tbody>
     {% for result in results %}
    <tr>
      <td align="center"><b> {{ result.filename }} </b></td>
      {% for predict_prob in result.predict_probs %}
        <td align="center"><b> {{ predict_prob.name }} </b></td>
      {% endfor %}
    </tr>
    <tr>
      <td align="center">
        <img src="inputs/{{ result.filename }}" style="width:244px;height:244px;"/>
      </td>
      {% for predict_prob in result.predict_probs %}
        <td class="vert-align" align="center"> {{ predict_prob.prob }} </td>
      {% endfor %}
    </tr>
     {% endfor %}
     </tbody>
</table>
{% endblock %}
Further Reading
For more complex visualizations, see the examples in the visualizations module.